
What's next for the global economy and financial markets?

Below, we outline some of our key views on the factors set to drive financial markets over the coming months, and what this means for our investment strategies.
Kayak next to lake

US company earnings surge

The second quarter US earnings season saw earnings per share (EPS) growth hitting 52% – the highest level since the post-Covid recovery of 2021 – with only one underlying sector in the S&P 500 Index of US companies (healthcare) failing to report earnings growth. In all, 85% of S&P 500 companies beat expectations, helping US corporate profits to hit $4.8trn in the second quarter. This was a record share of national income (18%) and follows the $4.42trn total profits in the first quarter. 


Within this, Alphabet (Google), Amazon, Nvidia and Microsoft also booked an additional $160bn of gains on their stakes in OpenAI, Anthropic and SpaceX. This helped to bring ‘blended’ earnings growth (which combines actual results with forecasts for those yet to report) for the technology sector to 75.3%. Meanwhile, the ‘Magnificent 7’ cohort of technology mega-caps enjoyed earnings growth of 118.5%, thanks to their additional AI investments.  


Consequently, Alphabet’s results pushed earnings growth in the communication services sector to 116.9% while Amazon’s numbers took EPS growth in the consumer discretionary sector to 92.4%. 


Meanwhile, US banks flourished, thanks to record IPO and AI-related trading receipts, while energy and defence stocks advanced on the back of the Iran war.


US inflation steps down in June and July


Reported US inflation continued to ease in July and August. Mid-July saw two US inflation surprises that helped both stock and bond markets to rally. First, June’s annual Consumer Price Index (CPI) reading came in at 3.5%, sharply down from May’s 4.2% driven by painfully high gas prices, and well below the 3.9% forecast. June saw monthly CPI enjoy its biggest decline since 2020, thanks to an almost 10% drop in gas prices at the pumps. Meanwhile, core inflation, which strips out volatile food and energy costs, dropped from 2.9% in May to 2.6% in June. 


A day later, the same fall in energy prices helped Producer Price Index (PPI) inflation, also known as ‘factory gate inflation’, to its biggest monthly drop in over a year. Wholesale costs fell 0.3% in June (although this was subsequently revised to 0.1%) while core PPI rose by less than expected (0.2%), taking annual PPI to 5.5%. 


A month later, US CPI declined to 3.4% in July with core inflation easing to 2.5% while US PPI remained flat. The news helped the S&P 500 Index hit another record high.


Treasury intervention and the ‘debasement trade’


After a gruelling climb in US Treasury (government bond) yields that took the yield on 30-year bonds to a 19-year high (5.31%), meaning that prices were at record lows, mid-August saw Treasury secretary Scott Bessent announce that the Treasury would intervene in the US bond markets. 


He announced a plan to “at least double” its buyback operations for longer-dated government bonds (from $2bn to $4bn), removing less liquid issues from circulation. This provided a temporary boost to stock and bond markets, and helped Treasury yields to ease, but they subsequently reversed course to give up these gains. 


The news that the US Treasury felt it necessary to intervene triggered a powerful rally in commodities and alternative assets as investors looked to move away from the US dollar and dollar-denominated assets in what’s referred to as a ‘debasement trade’. Gold jumped over 4% on the day of the announcement, on the way to its third best month of the 21st century with gains of over 12% that took the yellow metal back into positive territory for 2026. 


Other precious metals also rallied as did metal mining stocks and crypto currencies as investors sought alternatives to dollar exposure. 

Our chart of the month
IT sector chart
Source: FactSet, Handelsbanken Wealth. Data as at 11 September 2026.

What this chart tells us

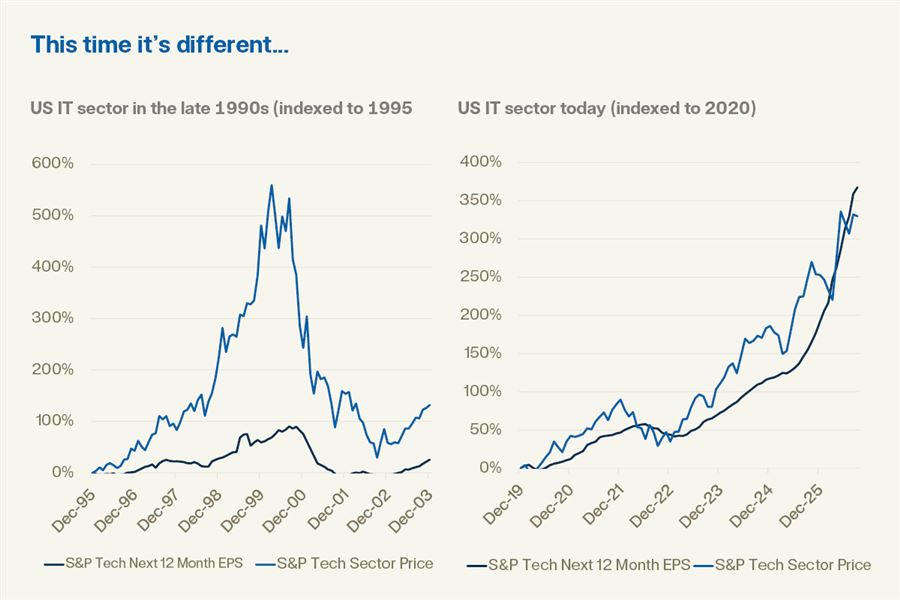
Although the words ‘this time it’s different’ are among those most mistrusted by professional investors, it’s clear that the current boom in US technology stocks has little in common with the dot-com boom of a quarter century ago. This time around, a completely different technology is driving markets higher, creating an entirely different picture.  


As the chart illustrates, back in 1998 and 1999, the valuations for technology stocks in the S&P 500 Index came unmoored from their earnings, rising almost vertically on the promise of stellar future returns from a newly-arrived internet that was still in its infancy. As the black line shows, these earnings never materialised in anything like the timescales imagined at the time. 


By contrast, the current ‘bull market’ in technology stocks is being driven by persistent earnings growth from companies exposed to the AI buildout theme. Technology stocks at every stage of the supply chain are benefiting from a steep increase in hardware sales with investment into information processing equipment up over 30% in the year to the end of June 2026.
The value of such investment has now surged to 2.45% of US GDP – its highest share of the US economy in over 20 years.

Select each drop down to find out what our market views mean for positioning in our investment funds.


Read more

  • What do we think about stock markets?

    Hopes of a ceasefire in the Iran war, moderating inflation and blockbuster corporate earnings have restored the outlook for stock markets.

    • July opened with President Trump announcing the previous 60-day ceasefire with Iran to be over after the two nations fell into tit-for-tat military exchanges. The oil price subsequently jumped over 10% in the first week of the month, on its way to a 25% rise in July. It subsequently eased by around 7% in August.
    • This meant that brent crude rose from $71.5 a barrel on 1 July to circa $90.5 a barrel by the end of August. Although it briefly passed the $100 a barrel mark in July, forcing both stock and bond markets to recoil, the oil price remained well below the $140 peak it hit in April.
    • UK shares outperformed those of other developed markets in July thanks to the UK market’s pronounced weighting to oil and gas stocks, and investors looking for defensive exposure as the Iran war ratcheted up once more. However, they were entirely flat in August as investor risk appetite returned amid a re-kindling of the AI investment narrative.
    • Despite a backdrop of blockbuster earnings for technology stocks, it was a volatile period for valuations – especially among chip-making stocks. By mid-July the Philadelphia Semiconductor (or SOX) Index, which tracks the 30 largest US chipmakers, had suffered a weekly decline of close to 10%. This took the index into ‘bear market’ territory, having retreated over 20% from its June peak. However, by early August investors had returned to the AI buildout theme with the SOX Index bouncing back over 9% in the space of a week.
    • Among our thematic holdings, decreasing regulatory hurdles have paved the way for a succession of major new M&A and IPO deals in the biotech space. This, along with a number of new breakthroughs, especially in the field of cancer treatment, has helped biotech stocks to become the best performing subsector of the US stock market this year, repaying our conviction in such companies.
    • Our new position in essential metal miners has been quick to reward. We initiated this holding on the basis of the supply squeeze created by rising government spending on infrastructure and defence, the sprawling AI buildout, and the green energy transition. However, it became our top-performing stock market holding in August thanks to the ‘debasement trade’ which saw investors seeking alternative stores of value such as gold, precious and essential metals, and digital currencies.
    • Our insurance holding continues to lag in steeply rising markets although it tends to outperform when markets turn defensive. The sector is underpinned by the business necessity for insurance, and by the secular rise in insurance premiums due to climate change, and the rising prevalence of both electric vehicles and cyberattacks.
    • We remain broadly overweight to stock markets as, despite the background noise, the recent rally in share prices has been driven by sensational earnings growth, not hype – especially in the US and emerging markets. The US is enjoying a notably broad-based acceleration in earnings with 10 of the S&P 500 Index’s 11 underlying subsectors delivering EPS growth in the second quarter earnings season.
    • The strength of the earnings story – especially in the US – has enabled stock markets to so far ignore the rising yields on government bonds. Indeed, the strength of corporate earnings has been so great that price to earnings (P/E) valuations in the US remain around the 20x mark. This is a very modest level considering the growth we’ve seen in valuations and one that investors remain happy to pay. 
    • This underlines that, despite the prominence of technology companies in today’s stock markets, there’s no valuation ‘bubble’ emerging. Instead, the outsized earnings growth we’re seeing is a result of the consistent economic growth we’re seeing alongside the mammoth investments that are supporting the global AI buildout.
    • Recently, the two factors that most disquiet stock markets, namely inconsistent growth and rising interest rates, have been absent. Global economic data continue to be supportive, with positive surprises still outnumbering negative ones, while inflation in most major economies has generally undershot expectations. It’s mostly stuck in a corridor of between 2% and 4%.
    • This is akin to a ‘goldilocks scenario’ for stock markets. It’s appreciably better than the ‘stagflation’ (stagnating growth and rising inflation) scenario that occupied some investors earlier this year, and is chiefly responsible for the strength of stock market returns this year relative to other asset classes.
    • Although inflation remains at manageable levels, much will hinge on the outcome of the Iran war and the path of wholesale natural gas prices as another European winter looms. Currently there are signs that energy price inflation is filtering through to ‘headline’ inflation, but ‘core’ inflation remains mostly contained while we may see rising fuel prices acting to curtail discretionary spending elsewhere.
    • While recent research has highlighted an increase in the number of adverse geopolitical events to impact markets over the last four years, reflecting the ongoing rise in populist politics and a second Trump administration, such geopolitical risks have done little to hamper returns. Markets have clearly become accustomed to drawing a line beneath such events and moving on. 
    • We continue to seek opportunities outside of the US stock market. Thanks to our overweight towards more cyclical regions – ie those more driven by the economic backdrop – our portfolios are also marginally overweight to ‘value’ investing and to smaller companies, relative to our long-term averages.
    Our stock market exposure
    • As at 1 September 2026, the Handelsbanken Wealth Balanced Multi Asset Fund, which sits at the mid-point of our portfolio range in terms of the balance between risk and reward, held 67.7% of its portfolio in company shares – a small overweight compared to our long-term average weighting.
    • Within this, we remain underweight to US stocks versus our long-term average, although the US remains our largest regional weighting. It accounts for 49.7% of our total stock market exposure. Conversely, we’re overweight to the stock markets of more economically sensitively regions, chiefly the UK and emerging markets.
    • We are underweight in Japanese companies, as we see more compelling opportunities elsewhere.
    • The Balanced Multi Asset Portfolio has thematic exposures to UK and US smaller companies, biotech, sustainable infrastructure, metals and mining, and insurance sector stocks.
  • What do we think about bond markets?

    Bond markets remain vulnerable to energy prices, geopolitical upsets, mounting concerns as to debt levels and the likely path of inflation from here.

    • With the price of oil and wholesale natural gas climbing amid escalating tit-for-tat exchanges in the Middle East, government bonds came under concerted pressure in the summer months. Both UK government bonds (gilts) and their US counterparts (Treasuries) suffered painful losses in July that weren’t recouped by August’s modest gains.
    • The same was true of higher-quality corporate bonds (issued by companies), known as ‘investment grade’, and emerging market bonds. After suffering smaller losses in July, high-yield bonds (of lower credit quality) managed to more than recoup these declines in August, reflecting the greater investor risk appetite in evidence late in the period.
    • The biggest story of the summer for bond markets was the concerted rise in government bond yields (meaning their prices fell). By the end of August, the yield on 10-year US and UK government bonds stood at 4.75% and 5.14%, respectively, but they continued to rise into early September. This reflected stewing investor misgivings as to the ever-growing level of government debt, with total US debt passing the $40trn mark during the period, the long shadow cast by the ongoing Iran war, a Fed chair seen as being ‘hawkish’ (meaning he favours interest-rate hikes), and a broader market that’s flooded with corporate bond issuance in support of the mammoth AI buildout.
    • Although 10-year bond yields floating around 5% was nothing unusual between 1970 and 2007 (the onset of the global financial crisis), the world has changed greatly since then. Back then, debt burdens were much lighter with US debt to GDP just 30% in 1980 and approaching 60% when the financial crisis hit. Today it’s closer to 120% of GDP with US debt repayments now costing over $1trn a year.
    • Higher bond yields increase the cost of government debt repayment and so hamper spending plans. This is a global problem with government bond yields now at, or around, multi-decade highs in the US and UK, Germany, France and Japan. In time, this could act to curb global growth and reduce equity valuations.
    • Government debt repayment gobbled up $2trn among the members of the OECD (Organisation for Economic Co-operation and Development) in 2025, or around 3% of combined GDP. It now outweighs defence spending in the US, UK, France, and a dozen other OECD member states. This year, OECD nations are expected to borrow $18trn – another all-time high – while refinancing existing debts at ever higher yields.
    • With little in the way of forward guidance emanating from the new-look Fed, incoming chairman Kevin Warsh managed to trigger a sell-off in both US Treasuries and the dollar when he kept US rates on hold in July but left investors in the dark as to why the Fed hadn’t already raised rates. Meanwhile, his ‘hawkish’ tone when addressing the annual Jackson Hole symposium at the end of August was sufficient for market traders to almost double the odds of a rate hike at September’s Fed meeting, and for the dollar to notably strengthen.
    • The Bank of England also kept interest rates on hold, which was interpreted as a ‘dovish’ move – namely one that favours reducing interest rates to help boost the economy. We are still of the mind that expectations for UK rate hikes in 2026 are overdone considering Britain’s anaemic economy, and this continues to underpin our overweight position in short-dated gilts.
    • By mid-August, the yield on 30-year US Treasuries had hit a 19-year high. This was when Treasury secretary Scott Bessent announced that the Treasury would intervene in the US bond market. This provided only a temporary boost to stock and bond markets, while commentators immediately pointed to the growing schism between the US Treasury and the Warsh-led Fed.
    • More attractive valuations are returning to government bonds which help to revive their value as portfolio diversifiers. However, whether investors see a 5% bond yield as being sufficient to tempt them away from stock market investments remains to be seen.
    • With no other appreciable changes to our view, this has left our total bond exposure at neutral. Within this, we are overweight to both UK government and investment-grade corporate bonds (issued by companies), relative to our long-term average, underweight to high-yield bonds and neutral on emerging market bonds.


    Our bond market exposure

    • As at 1 September 2026, the Handelsbanken Wealth Balanced Multi Asset Fund, which sits at the mid-point of our portfolio range in terms of the balance between risk and reward, held 21.8% of its portfolio in bonds, a small underweight relative to our long-term average weighting. Within this, 7.3% was in conventional government bonds, the majority of which was in gilts of short to medium-dated maturities. 
    • The fund also held 8.4% in high-quality, investment-grade corporate bonds (issued by companies) with a 3% weighting to higher-yielding bonds of lower credit quality. This represented a slight underweight compared to our long-term average weighting.
    • The fund’s small position in emerging market bonds was in line with our long-term average weighting.
  • What do we think about alternative assets?

    The ‘alternative’ investment space covers an enormous universe of competing strategies and asset classes from gold, commodities and commercial property to specialist hedge funds that employ a diverse spectrum of strategies. Consequently, broad statements as to our view on the market as a whole are unhelpful.


    In the alternatives space we hold only gold, a select group of hedge fund strategies, and a small position in commercial property.


    Although we’re broadly underweight to alternatives, relative to our long-term average weighting, we have significant positions in gold, hedge funds, and a small but growing exposure to property assets where we’ve recently been reducing our underweight.


    Gold: The outlook for gold has improved thanks to the ‘debasement trade’ and the prospects for a weakening US dollar.

    • Gold enjoyed its strongest run up in decades in 2025, and moved higher early in 2026 due to geopolitical risks and central bank purchases. While gold has lost some of its momentum since the outbreak of the Iran war, the long-term investment case remains compelling. 
    • The news of US Treasury intervention in the bond markets fuelled a powerful rally in commodities and alternative assets as investors looked to move away from the US dollar and dollar-denominated assets in what was referred to as a ‘debasement trade’. The announcement saw gold jump over 4% on the day. It went on to enjoy its third best month of the 21st century with gains of over 12% in August.
    • With investors actively seeking alternatives to US-dollar exposure alongside continued central bank purchases, we expect to see the debasement trade helping support gold demand for the remainder of the year. Even so, we remain slightly underweight to gold, relative to our long-term average.

    Hedge funds: Our hedge fund exposures have helped to protect our portfolios during the recent spike in market volatility

    • We hold hedge funds to protect us from violent market disruptions by providing returns with uncorrelated returns to the movement of stock and bond markets. Our trend-following hedge fund has continued to reward us in 2026 thanks to persistent market trends across asset classes, combined with active risk management. It remains an attractive way for us to ‘hedge’ the risk of sudden market declines, or protracted market sell offs.
    • We remain overweight hedge funds relative to our long-term average, with a preference for highly liquid managed futures strategies. These employ derivative strategies to trade across commodities, shares, bonds and currencies and tend to perform well in strongly trending markets.

    Property: The outlook for property has improved, but we remain underweight given opportunities elsewhere

    • Currently, economic indicators suggest that our neutral to marginally underweight position in global real estate is the correct stance given the attractive opportunities elsewhere within public markets.
    • We continue to believe that investing via global property approaches is to be preferred given the wide variety of profitable sub-sectors in areas such as data centres, healthcare and industrials. While we see select opportunities in individual UK names, valuations have deteriorated a little as the listed property sector continues to consolidate.

    Our alternatives market exposure

    • As at 1 September 2026, the Handelsbanken Wealth Balanced Multi Asset Fund, which sits at the mid-point of our portfolio range in terms of the balance between risk and reward, held 9.9% of its portfolio in alternatives. These are intended to provide diversification to traditional assets alongside attractive absolute returns for our investors. This was split between a 2.4% weighting to property and a 4.2% weighting to gold – both underweights relative to our long-term averages – and a slight overweight to hedge funds (3.3%).
    If you’d like further information on how we divide investments in our strategies across different types of assets (i.e. our asset allocation framework, and our tactical deviations away from it), please contact us.

Important Information

The value of investments and any income from them can fall and you may get back less than you invested.

Handelsbanken Wealth is a trading name of Handelsbanken Wealth & Asset Management Limited and is authorised and regulated by the Financial Conduct Authority (FCA) in the conduct of investment and protection business with firm reference number 197340, and is a wholly-owned subsidiary of Handelsbanken plc. This document has been prepared by Handelsbanken Wealth for clients/potential clients who may have an interest in its tax services. These tax services are not regulated by the FCA. The provision of this information does not constitute tax advice.

Although every effort has been made to ensure accuracy, the information provided is based upon our understanding of current tax law and the prevailing practice of HM Revenue & Customs; tax rates and legislation are subject to change. We cannot guarantee to inform you of any such changes and we accept no responsibility for any inaccuracies or errors. Your personal circumstances may affect the outcome of any measures you choose to implement and we recommend you take independent professional advice. We cannot accept responsibility for the consequence of any action taken or failure to take action by a reader on the basis of the information provided. Tax figures and legislation are correct as at May 2026 but are subject to change.

This does not constitute any recommendation to buy, sell or otherwise trade in any of the investments mentioned. Handelsbanken Wealth and cannot accept responsibility for the consequence of any action taken or failure to take action by a reader on the basis of the information provided. When we provide advice in relation to investment, our own investment management services will usually be recommended. When advice on pensions or other products outside an investment management relationship is required, we will recommend products chosen from a limited selection of providers that have been appointed on the basis of its judgement in their quality of service, investor protection, financial strength and, if relevant, their financial performance. As a result, any advice given by Handelsbanken Wealth in respect of retail investment products will be restricted as defined under the FCA rules.

Registered Head Office: 25 Basinghall Street, London EC2V 5HA. Registered in England No: 4132340

You might also be interested in

29 September 2026

Why take a long-term approach to investing?

Explore how a long-term investment approach can help you manage short-term uncertainty and benefit from potential growth over time.

Why take a long-term approach to investing?
Man in suit and glasses smiling
1 September 2026

‘Time in the market, not timing the market’

The reason that some expressions pass into investment cliché is because they’re true. This old adage is as true today as it’s always been.

‘Time in the market, not timing the market’
Family jumping into lake
6 July 2026

Understanding ISAs

Learn how ISAs can help you save and invest tax-efficiently, and understand the different options available to you.

Understanding ISAs
Dad and two children in kitchen
6 July 2026

Making Tax Digital for Income Tax

Learn about HMRC's Making Tax Digital for Income Tax initiative, including who is affected, key deadlines and reporting requirements.

Making Tax Digital for Income Tax
Man using laptop